by Mohamed Nasr
Fun rating: 3/5

Difficulty rating: 4/5

What is the general purpose?
A microarray’s general purpose is to quantify the binding, also called hybridization, of a nucleic acid sample to certain probes.
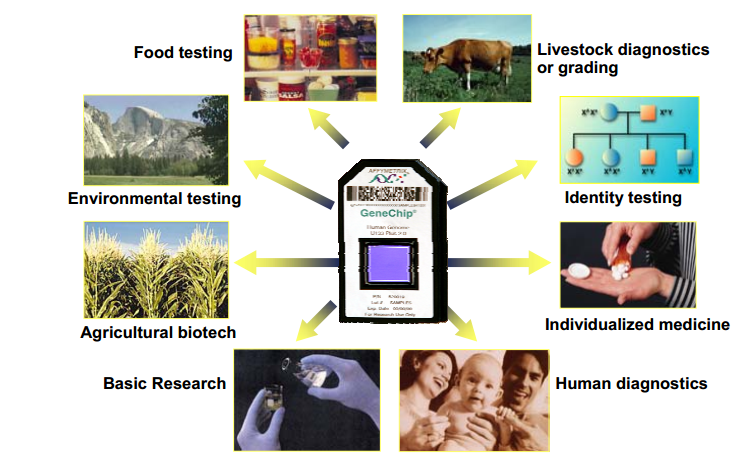
Why do we use it?
We use microarrays for a variety of biological and biotechnology applications, as in figure (1). These applications include assessing gene expression profile (measuring to which extent each gene is being expressed), detecting small changes in DNA (sometimes called single nucleotide polymorphism, SNPs) that might be associated with disease, and performing molecular diagnostics.
How do microarrays work?
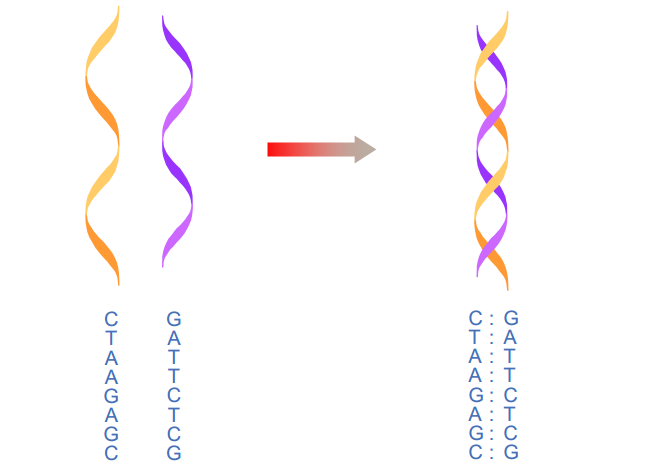
A DNA microarray, also called a gene chip, is a technology that is based on the hybridization (binding) of complementary nucleic acids strands. During hybridization, complementary nucleic acids strands (for example, A is complementary to T and C is complementary to G) form hydrogen bonds between each other to form stable double stranded nucleic acids. See figure (2).
DNA microarray makes use of this hybridization phenomenon to measure gene expression in biological cells or to investigate the presence of a specific nucleic acid sequence in your biological sample. But how do these microarrays work? Before we go into the mechanism of action, we first need to know a very important term: DNA probes. DNA probes are short single-stranded DNA sequences that you design. In microarrays, we use DNA probes that are complementary to the messenger RNA (mRNA) of specific genes we are interested in studying. If the genes we are interested in bind to the probes we designed, we can tell that our sample is expressing these genes.But, how do we know that our RNA hybridized to a specific probe? We label our nucleic acid sample with chemical compounds that emit fluorescent light, called fluorophores. These fluorophores can then be detected by a fluorescence detector, a scanner. See figure (3).

Advantages
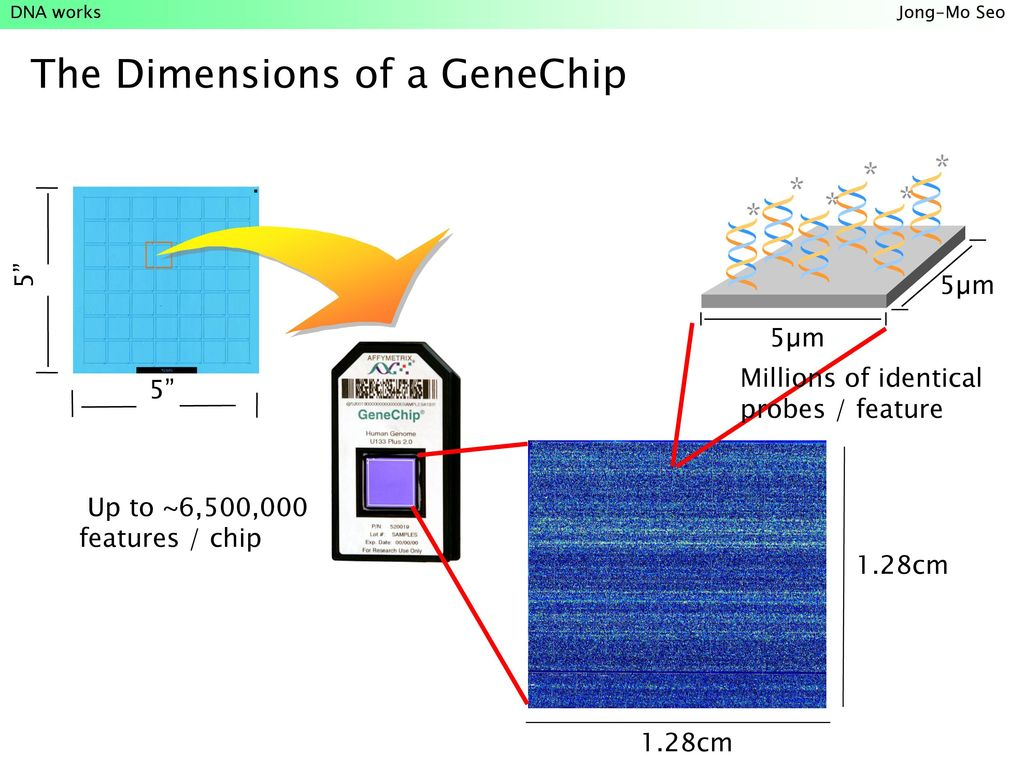
What makes microarrays special? To answer this question, we need to know how microarrays are designed. As in figure (4), a standard microarray chip is pretty small, only about 1.28 cm by 1.28 cm (or about half an inch). It is made of glass that is divided into very tiny separate spots, known as features (5µm*5µm), with each feature containing several copies of a specific DNA probe that represents a specific gene. A DNA microarray can contain up to several millions of features. The ability to detect thousands of different genes is what makes DNA microarrays so powerful..
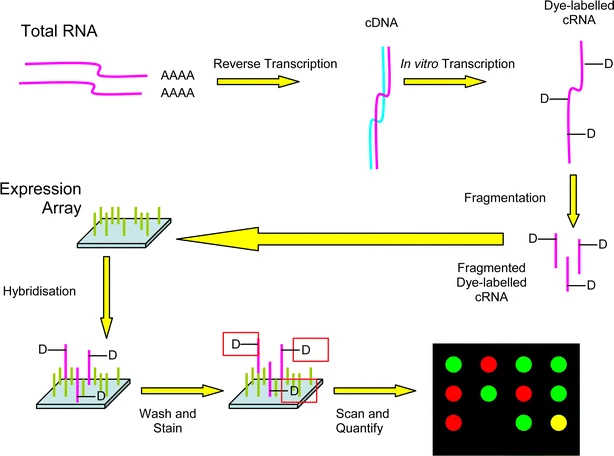
Technical steps
As in figure (5), the first step is to isolate your RNA sample and make sure it is pure. After that, we transcribe this RNA back into DNA, which we call cDNA. This process is known as reverse transcription. The word “reverse” comes from the fact that we transcribe RNA into DNA while in normal transcription DNA is transcribed into RNA. Following that, you label your sample by tagging it with a fluorophore. Next, add your mixture into the pinholes of the microarray. You then incubate overnight for hybridization. After hybridization, washing is required to get rid of excess materials and. Finally, the chip is scanned using a scanner with fluorescence detector and the amount of fluorescence is measured for each gene.
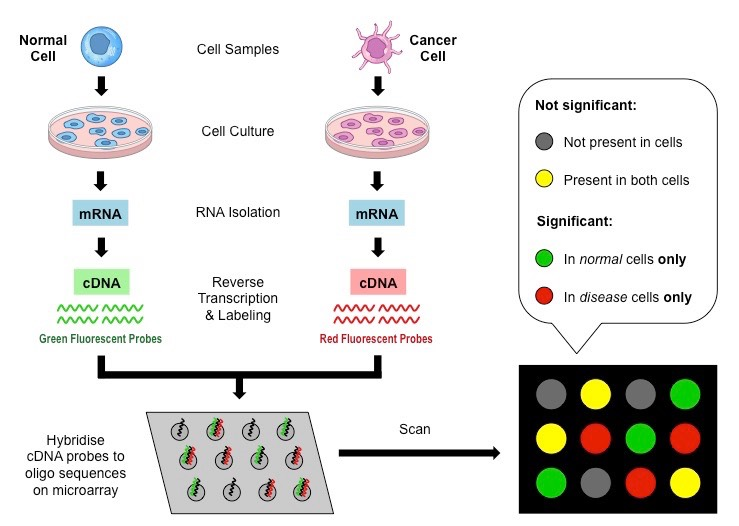
Comparing two samples using one microarray
Now, if we want to compare gene expression in two samples, how can we accomplish this? We label them with different colors. In this case, the scanner measures the fluorescence of each color and we can then use these measurements to find the ratio between the fluorescence of each color. This ratio can be used to indicate which sample expressed more of the gene of interest. See figure (6).