By Yasemin Cole
Fun Rating: 4/5
Difficulty Rating: 4/5

What is the general purpose?
Mass spectroscopy is a technique used to find the structural and chemical properties of a molecule. For example, this molecule could be from a patient’s blood or from lysate (the material inside of cells). What makes this technique unique is that you do not necessarily need to know what molecule you are looking for. Mass spectroscopy can be used to identify and count a molecule by its molecular weight.
Why do we use it?
Mass spectroscopy is a critical tool in the field of chemistry and currently has applications in medicine and biomedical research.
For example, when babies are born, a small sample of blood is taken from their heels, called a “heel prick”. This blood is then put into a mass spectrometry machine for newborn screening. This screening test is used to evaluate whether the baby has any treatable conditions, such as phenylketonuria. In phenylketonuria the level of phenylalanine is high so mass spectroscopy is used to detect the high levels of phenylalanine.
How does it work?
Say you are conducting a study to see if patients with cancer produce unique molecules in their blood. You are interested in identifying a biomarker that can be used to track the spread of patients’ cancer. However, you do not know the identity nor amount of these molecules. Mass spectroscopy would be the ideal technique to use.
Before using mass spectroscopy you need to process the samples that you are characterizing the molecule(s) in. For example, if you want to select specific proteins and remove other proteins, you may have to use a process called chromatography (this is a topic for another technique blog!).
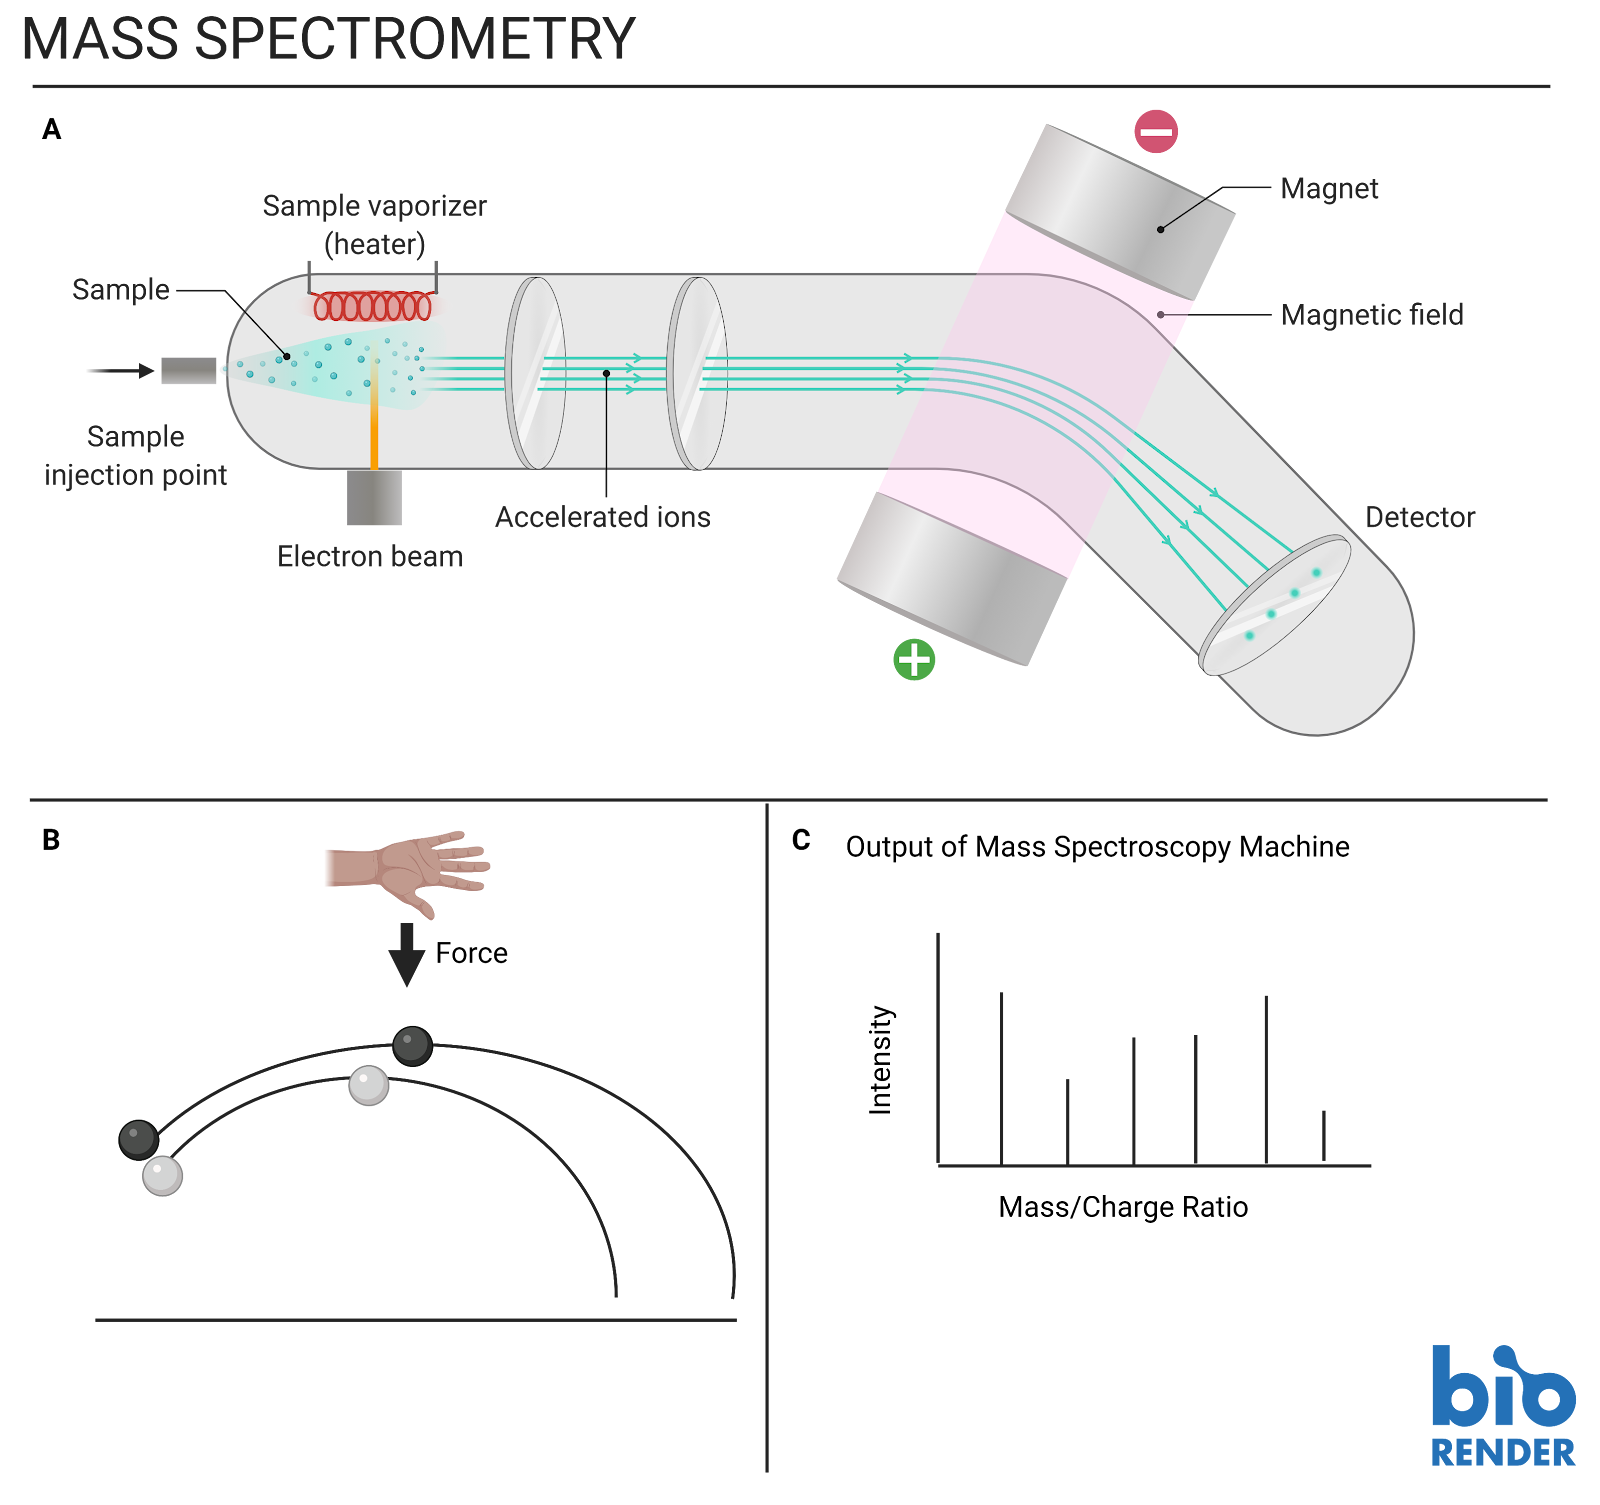
Now that you have isolated the molecules you want to study from a patient’s blood, you can move on to the fun stuff – mass spectroscopy! Molecules have a mass (based on the atomic weight on the periodic table) and can have a charge. The charge of a molecule is determined by the number of protons (positively charged) and electrons (negatively charged) in a molecule. The output of mass spectroscopy is to measure the mass-to-charge ratio of molecules in your sample. The 3 main components of a mass spectrometer are:
- Ionization source – The first step in mass spectroscopy is to create a charge on the molecules so that they can be moved around by an external magnetic field (see electron beam in Figure A). The sample is “ionized” by an external source. Here the molecules lose or gain electrons and become charged (called “ions”). We need to ionize molecules because we want to be able to manipulate them with a magnetic field. Only molecules with charges are attracted/repelled by magnetic fields.
- Mass analyzer – The charged molecules are then shot through the instrument under the influence of a magnetic field. The more mass a particle in your sample has, the less it will move due to the magnetic field.
For example – If you think of a cannonball being shot, as it flies through the air it slowly starts to arc and curves downward. If you were able to travel with the cannonball and push it downward, it would deflect and curve downward. Now, think of a ping pong ball being shot at the same speed. If you pushed it downward with your hand, the ping pong ball would have a much larger deflection. This is because the ping pong ball has a lower mass than the cannonball. (Figure B)
This is similar to what happens in the mass spectroscopy instrument with molecules instead of a cannonball or ping pong ball. As molecules are shot through the instrument and under the force of the magnetic field, the molecules will “land” at different locations. This is dependent on the mass and the charge of the molecule.
- Detector – The separated ions are now measured by a detector depending on where they land (See Figure A). Each molecule that hits the detector has a mass and charge that is measured by the detector.
The results of mass spectroscopy are graphically represented on a chart for humans to read. The end result of mass spectroscopy is a graph showing the mass-to-charge ratio of each molecule (Figure C). In these graphs, each vertical line or “peak” is a unique molecule in the sample. On the x-axis is the mass-to-charge ratio (measured by the detector). The height on the y-axis represents how abundant that component is in the sample. You can use this information to count the number of molecules in your sample. In addition, by using the mass-to-charge ratio in the graphs and finding them in published databases, you can find the identity of each molecule.