by Henry Dieckhaus
Fun Rating: 3/5

Difficulty Rating: 1/5

What is the general purpose?
Scientists often want to know how one or more independent variables affect another dependent variable. For example, how much does an exam grade depend on how much sleep the student got the night before? To do so, they need to use mathematics to model the relationship between them. Linear regression is a technique designed to quantify how independent variables affect a certain dependent variable in a clear, interpretable way.
Why do we use it?
Linear regression is one of the oldest and simplest data analysis methods, and it is used countless times by scientists across the world every day. This is because it allows scientists to answer specific scientific questions such as “is X related to Y?”, “how much does the value of Y depend on the value of Z (or vice versa)?”, and “if I change X by some amount, how much will Y change?”
How does it work?
Let’s imagine we’re environmental scientists collecting atmospheric weather data, and we want to know whether different atmospheric properties are related to one another. Perhaps we suspect that temperature and relative humidity could be related, because hot air can hold more water than cold air. To test this hypothesis, we can use linear regression. Before we start the analysis, we first need to gather some data. Fortunately for you, I’ve already gone out and gathered some data for us. Figure 1 shows a set of several dozen measurements taken at various times, with temperature (in degrees Celsius) on the x axis and relative humidity (%) on the y axis.
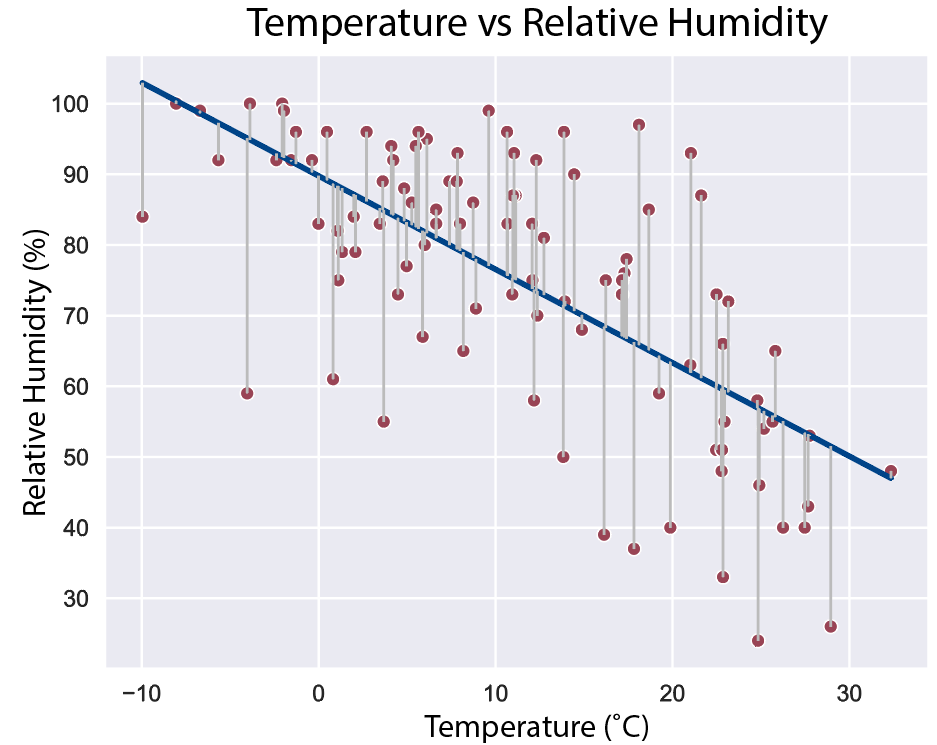
Figure 1. Scatter plot of temperature (°C) vs relative humidity (%). Graph generated by the author using data from the “Weather in Szeged 2006-2016” repository under a CC BY-NA-SA 4.0 license.
Just by looking at the data, we can see that there might be something to our hypothesis. It seems like measurements with lower temperatures tend to have higher relative humidity, while data points with higher temperatures tend to have lower relative humidity. As scientists, we would like to be able to quantify this pattern, and to do so, we will turn to linear regression. As the name implies, we are seeking to define a linear relationship between our variables, so we will attempt to draw a straight line that fits the classic equation: y=mx+b. In this case, y is relative humidity, x is temperature, m is the slope, and b is the y-intercept of the line, respectively.
But how do we decide where to draw this line? The most common approach is called ordinary least squares (OLS). The objective of OLS is to find the line with the minimum (“least”) differences (errors) between the y-values predicted by our regression line and the actual y-values in our dataset (also called residuals). We care more about values that are further away from the line, so we actually take the sum of the squares of the residuals. Figure 2 shows a regression line calculated using OLS, with the residuals drawn to illustrate the error between each predicted and actual y-value.
Figure 2. Scatter plot of temperature (°C) vs relative humidity (%) with ordinary-least-squares (OLS) regression line (blue line) and residuals (gray lines). Graph generated by the author using data from the “Weather in Szeged 2006-2016” repository under a CC BY-NA-SA 4.0 license.
Now that we have the equation for our regression line, we can use it to calculate just how strong (or weak) the relationship is between relative humidity and temperature. One common metric that is used for this is called R-squared (r2), also known as the coefficient of determination. It is essentially an expression of how much of the variance (spread) among the y values (relative humidity) can be explained by the linear regression model. Another interpretation of this statistic would be: if I want to predict the relative humidity, how useful is it to know the temperature? R-squared values can range from 0 (if the model is not useful at all) to 1 (if the model perfectly explains/predicts the dependent variable).
Our model has an r2 of 0.46, meaning that 46% of the variance in relative humidity can be explained by our model of temperature (plus the y-intercept). This is a decent r2 value, meaning that our model is moderately successful, but there is also much room for improvement, since a perfect score would be 1.00. One way we could improve our model is to add more variables, such as wind speed or barometric pressure, which might help explain more of the variance in relative humidity. This approach is called multiple linear regression, and it works much the same way as before, but with additional terms in our regression line: y=m₁x₁+m₂x₂ + m₃x₃ + … +b
From epidemiology to climate science, linear regression is an essential tool in virtually every scientific field. Fortunately, many commonly available software packages (such as Microsoft Excel and Google Sheets) and even some websites (such as WolframAlpha) are capable of processing data using linear regression without the user having to manually calculate residuals and define equations. Armed with this technique, scientists are better able to understand and quantify sophisticated patterns in behavior, biology, and much more.
