by Margaret Dedloff
Fun Rating: 4/5
Difficulty Rating: 2/5

Viral growth curves allow scientists to observe how a virus grows and replicates in cells – outside of an organism, such as a mouse or human. Viruses can be grown in a petri dish using many different types of cells, and different chemicals can be used to see how the virus responds and if the virus is still able to replicate.
Why do we use it?
Viruses cannot grow outside of another living organism. It can be challenging to understand how a virus grows in different cells when you’re infecting a mouse or another organism. To combat this, scientists are able to infect cells in cell culture and grow viruses. By taking samples from infected cells over time and quantifying the amount of virus in the sample using a focus forming assay, a plaque assay or quantitative real time polymerase chain reaction, scientists can observe how the virus is growing and replicating. This method is easy and more cost effective than methods of observing virus growth in whole organisms. Additionally, viral growth curves are customizable. Scientists can use different cell types – like green monkey kidney cells, or cells from cervical cancer – and can add different chemicals and compounds to see how these changes affect viral replication.
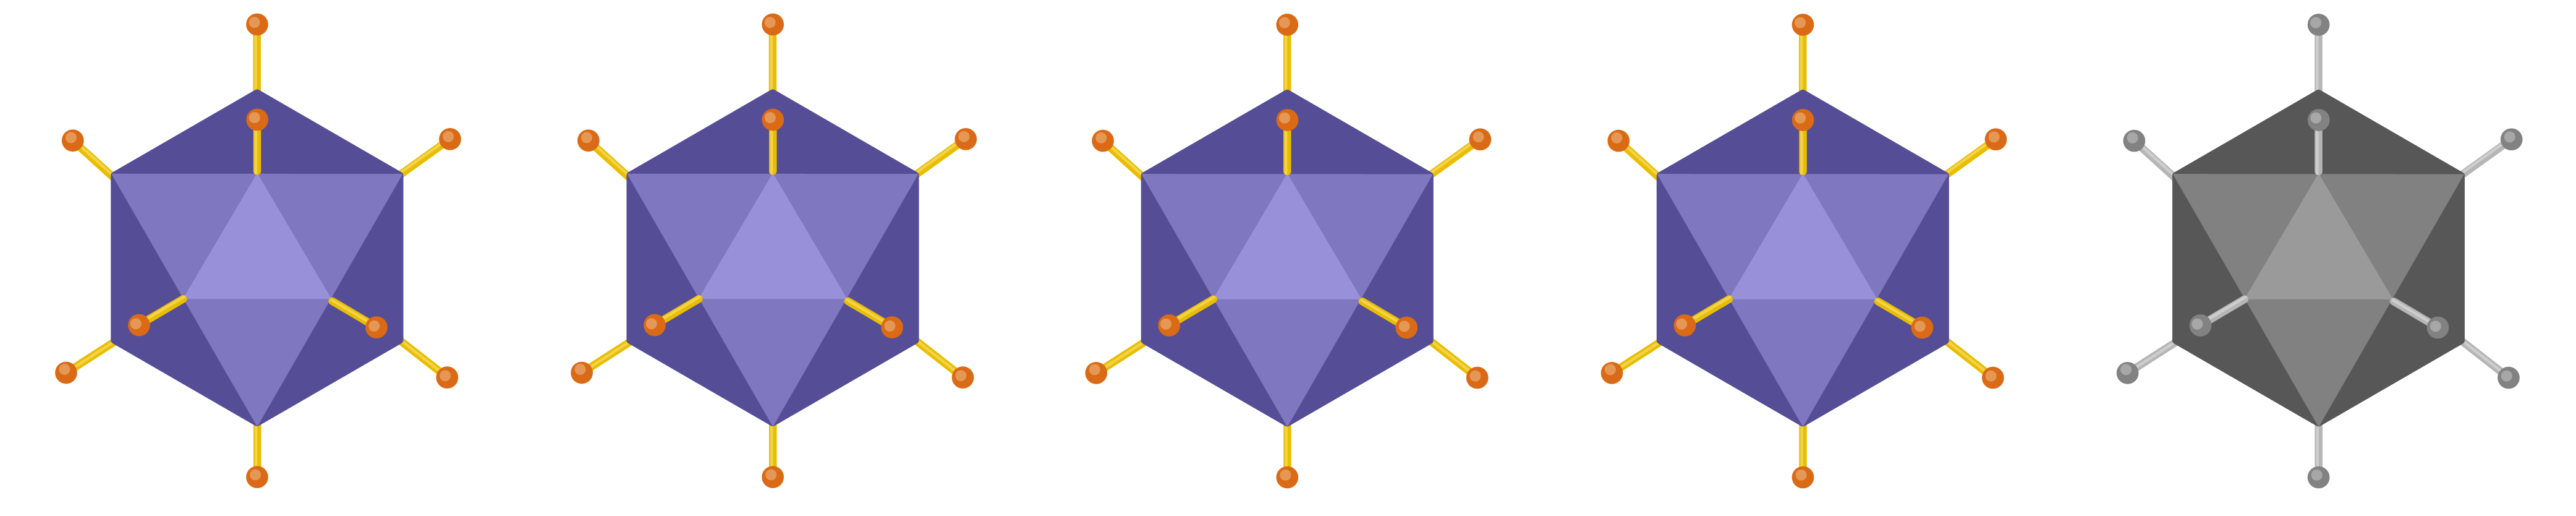
The viral life cycle creates a unique growth curve. When you first infect the cells, there will be viruses in the media the cells are growing in. Over time, the amount of viruses in the media will decrease as viruses enter the cells (1). The viruses will then replicate in the cell, during which time there won’t be viruses in the media (2). Finally, the viruses will be released from the cells over time and the amount of virus in the media will increase again (3).
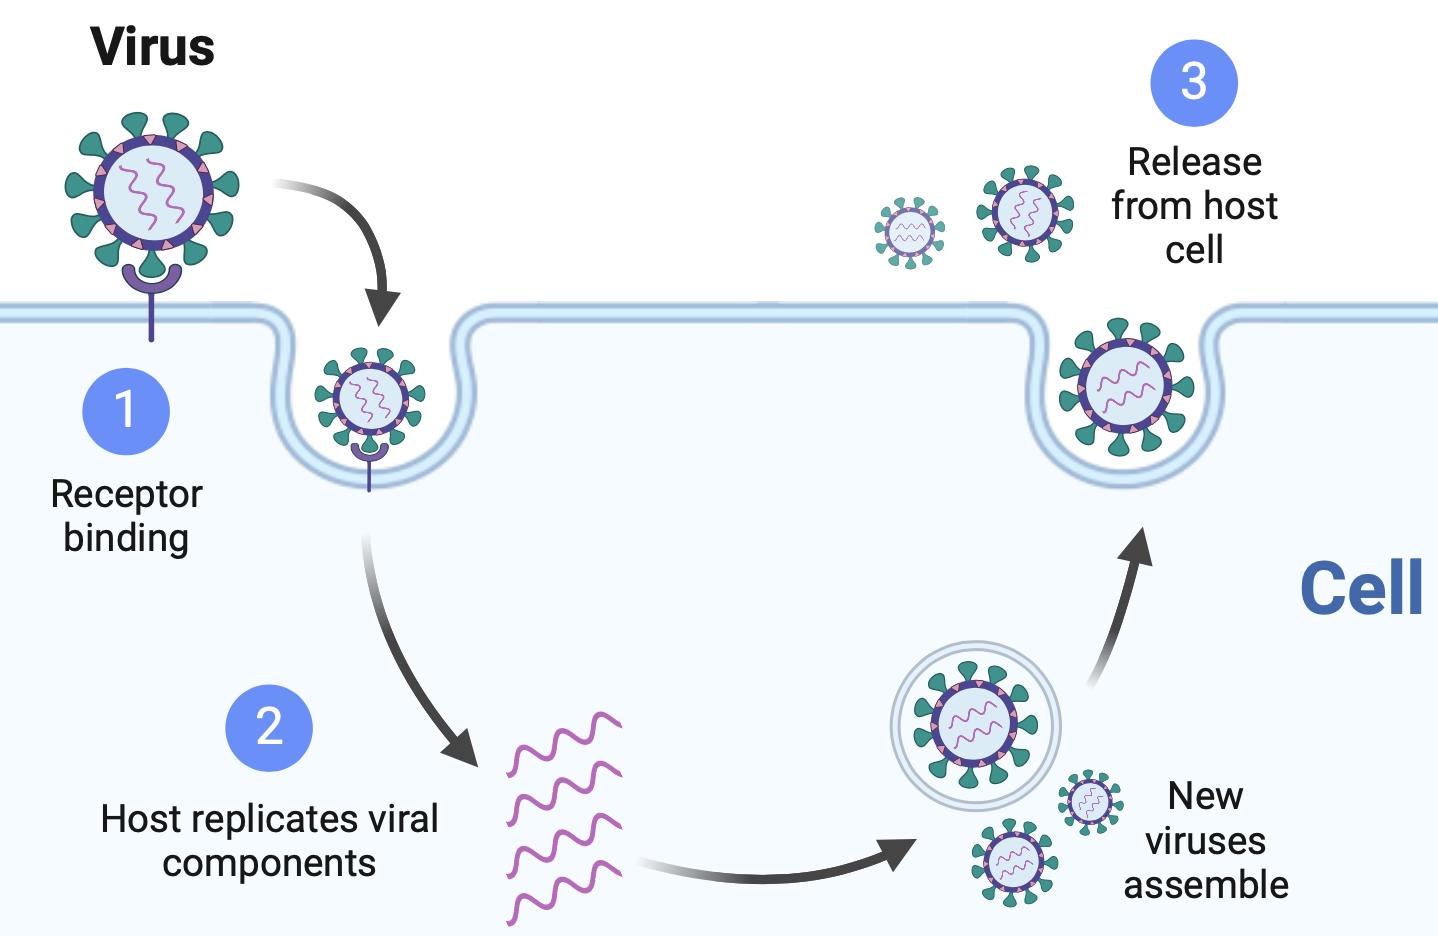
The viral life cycle. Image from Biorender.

An example of what a viral growth curve will look like. Image credit.
How does it work?
- The scientist chooses a type of cells and plates them on a plate a day before the virus infection is to take place.
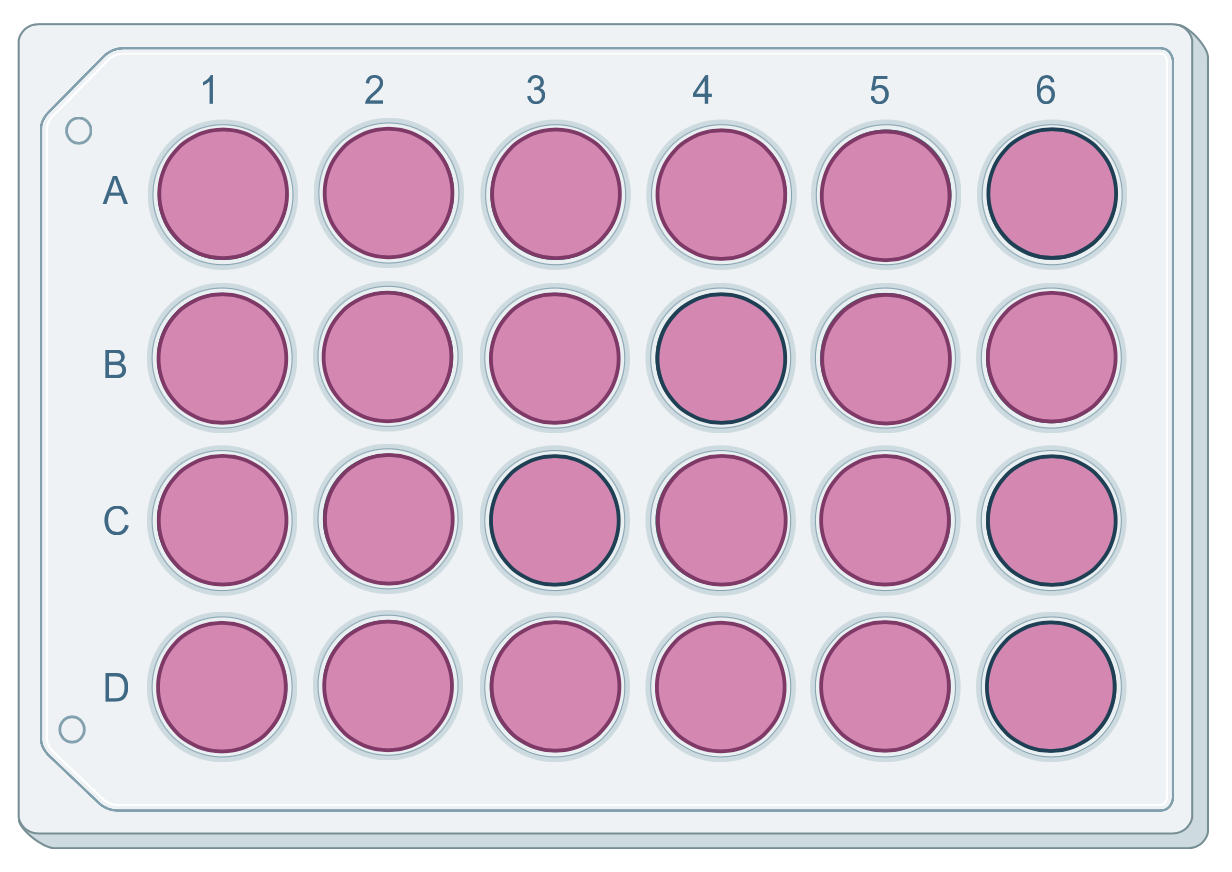
The first step of a viral growth curve is seeding cells, or adding a specified number of cells into a plate. Image from Biorender.
- The cells are then infected with virus at a specific multiplicity of infection. The multiplicity of infection is the number of viral particles to the number of cells in each well of the plate. For example, if in well A1 you have 1,000,000 cells and you add 1,000,000 viral particles, you would have a multiplicity of infection of 1.
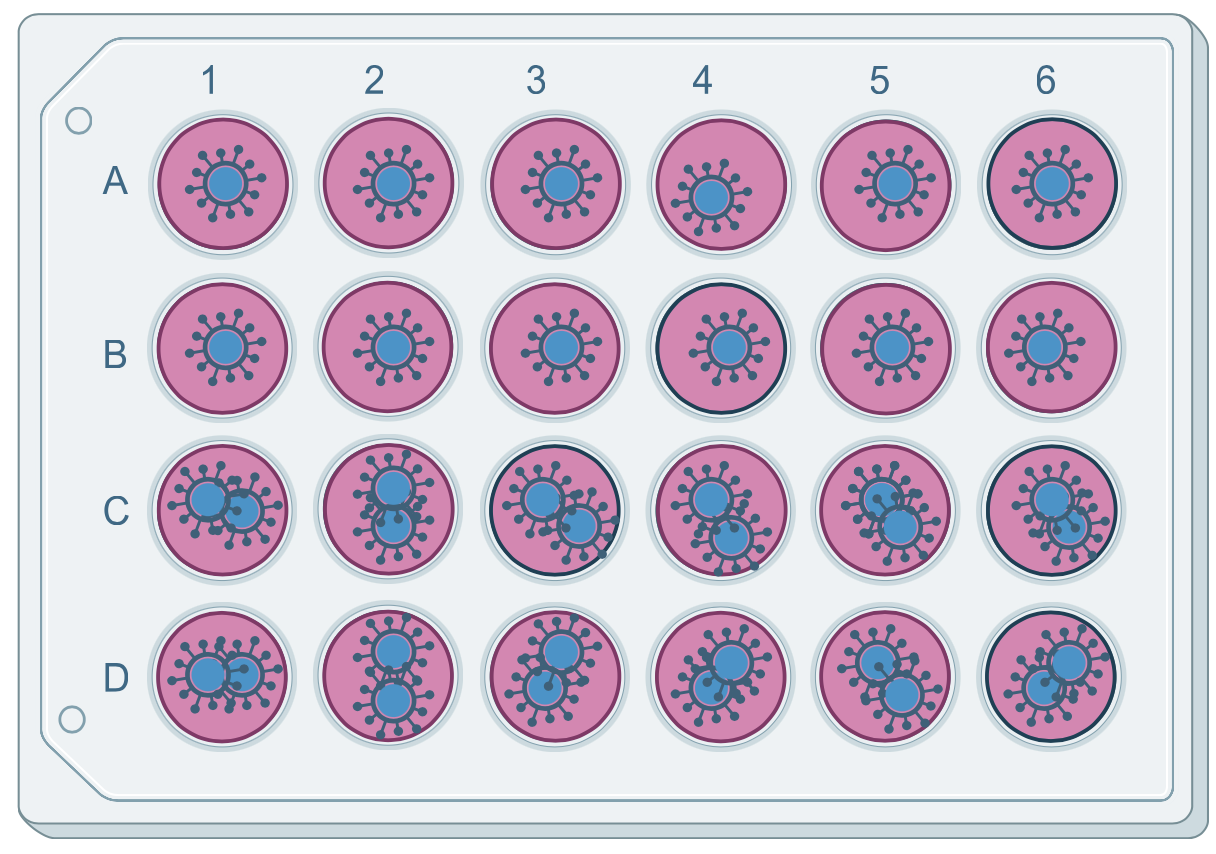
The second step of a viral growth curve is to infect the cells with virus. How much virus is used to infect the cells is up to the scientist performing the experiment. Image from Biorender.
- Next, at time points determined by the scientist, media is removed from the wells and stored. This is the sample containing the virus.
- The virus from the collected samples is then quantified using methods outlined above.
