by Ahana Mallick
Fun Rating: 4/5

Difficulty Rating: 4/5
What is the general purpose?
Flow cytometry rapidly measures and analyzes the physical and chemical characteristics of individual cells (or particles) from a liquid sample.
More specifically, it is used to:
- Identify and count different cell types in a mixed sample (e.g., distinguishing different types of cells in blood)
- Detect surface and internal proteins that define what a cell is or what state it is in
- Assess cell health — whether cells are alive, dying, or dead
- Analyze cell cycle stage — is the cell dividing? Resting?
- Sort cells — physically separate specific cell types for further experiments
Why do we use it?
We use flow cytometry because it solves a fundamental problem in biology: cells in a sample are not all the same, and we need a way to tell them apart quickly and precisely. We use it because the alternative — manually examining cells one by one under a microscope — is simply not feasible at the scale and speed modern biology and medicine require. It’s essentially the difference between counting cars on a highway by hand versus using an automated sensor.
How does it work?
The core principles of flow cytometry rely on three components: fluid dynamics (maintaining cells in a single file), lasers (to excite fluorescent dyes), and detectors (to record light signals).
Flow cytometry works by passing cells single-file through a laser beam and measuring the light each cell produces. Here’s the process from start to finish:
1. Sample Preparation: Cells are collected (from blood, tissue, etc.) and suspended in liquid.
2. Label Cells: To detect specific proteins, fluorescent antibodies are added that bind to their targets on or inside the cells.
3. Run through machine: The sample is injected into a stream of faster-flowing fluid (called sheath fluid). The pressure difference squeezes the cells into a single-file line — this is the “flow” part. It ensures cells pass the laser one at a time. This is called hydrodynamic focusing.
a. Laser Interrogation: Each cell passes through one or more laser beams. Two things happen:
- Scatter — light bounces off the cell. Forward scatter (FSC) is like the cell’s shadow, and measures cell size; side scatter (SSC) measures internal complexity of the cell (granularity).
- Fluorescence — if the cell has fluorescent labels, the laser(s) excite the dye molecules, causing them to emit light at a specific and unique color/wavelength.
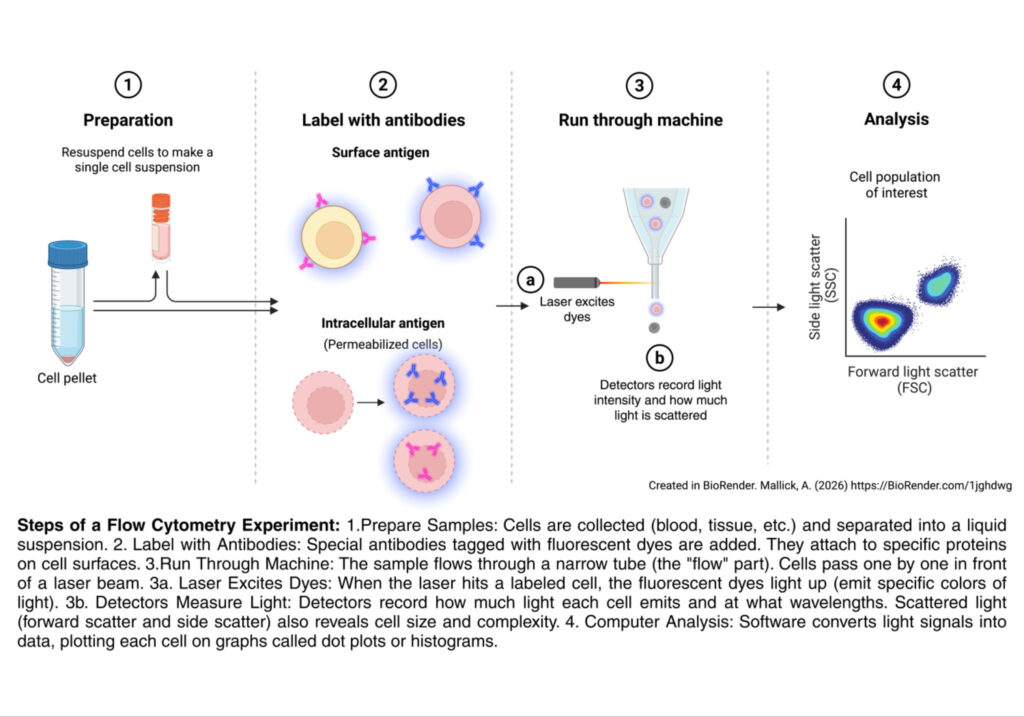
b. Detection: A series of mirrors and filters directs different wavelengths of light to different detectors. Each detector records the intensity of light it receives from each cell — essentially building a multi-dimensional “fingerprint” for every cell.
4. Data Analysis As each cell passes through a laser beam one at a time, the laser measures how the cell scatters and glows. These measurements are plotted as a dot on a graph. As it is done for thousands of cells, patterns emerge, creating a cluster of dots that each represent a different cell type.
Think of it like sorting a bag of M&Ms on a conveyor belt. A scanner reads each candy’s color and automatically drops it into the right bin. Flow cytometry does the same thing, but with cells instead of candy, and light signals instead of color. At the end, the number of cells of the same color end up in the same bin and can be counted. The result is a detailed, real-time snapshot of an entire cell population — who’s there, how many, what they’re doing, and how healthy they are — all from a single small sample, in a matter of minutes.
Here is an example of flow cytometry data from the blood draw of a healthy person versus a person fighting an infection. Each dot is one cell. Its position on the graph tells you two things at once — how strongly it glowed for one marker on the x-axis, and how strongly it glowed for a second marker on the y-axis. Cells that look similar end up in the same region of the graph, forming a visible cluster — just like all the red M&Ms ending up in the same bin.
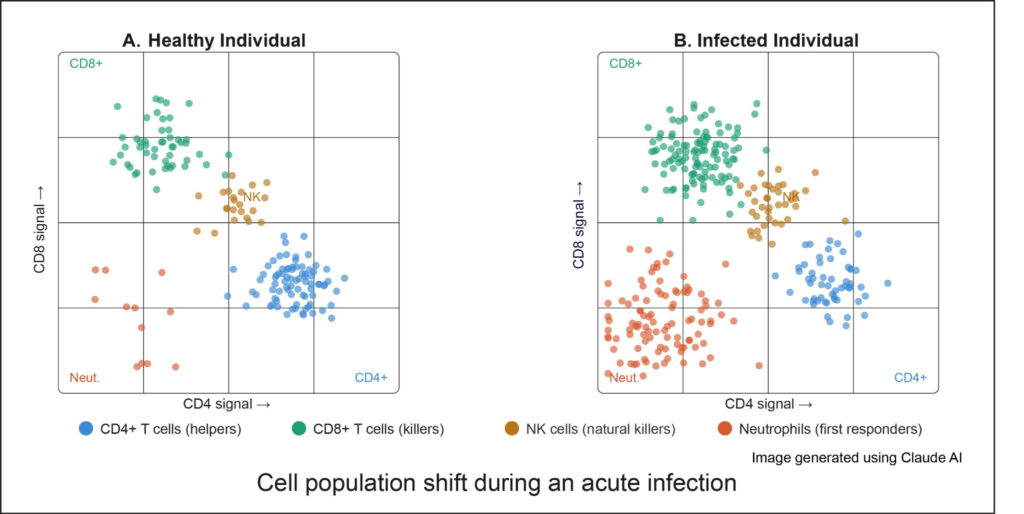
In panel A (healthy donor), you can see four clusters sitting in separate zones. Each cluster is a different immune cell type. The blue cluster in the bottom-right is CD4+ helper T cells — they glow brightly for CD4 but not CD8. The green cluster in the top-left is CD8+ killer T cells — the opposite pattern. The orange cluster in the middle is NK cells, and the red cluster near the bottom-left is neutrophils, which are dim for both markers.
Now look at panel B (day 3 of infection). The clusters are still in the same positions — same cell types, same bins — but the number of dots has changed. The green CD8+ cluster is noticeably larger, and the red neutrophil dots have exploded in numbers. More dots in a cluster mean more of that cell type in the blood. That shift in numbers is the signal. It tells a researcher — or a doctor — that the immune system has mobilized, calling up more killer T cells and neutrophils to deal with the threat.
